Networking on LinkedIn is fun and after just a few months of connecting with people, you can have yourself a network of thousands of connections.
However, did you ever stop and take a better look at your network? Where are your connections from, what do they do, and which industries do they occupy?
Understanding the structure of your network can give you valuable insight if you’re connecting with the right people.
In this guide, we’ll take a look at how you can visualize your LinkedIn network with just a few clicks.
Let’s get started.
How To Visualize Your LinkedIn Network With LeadDelta
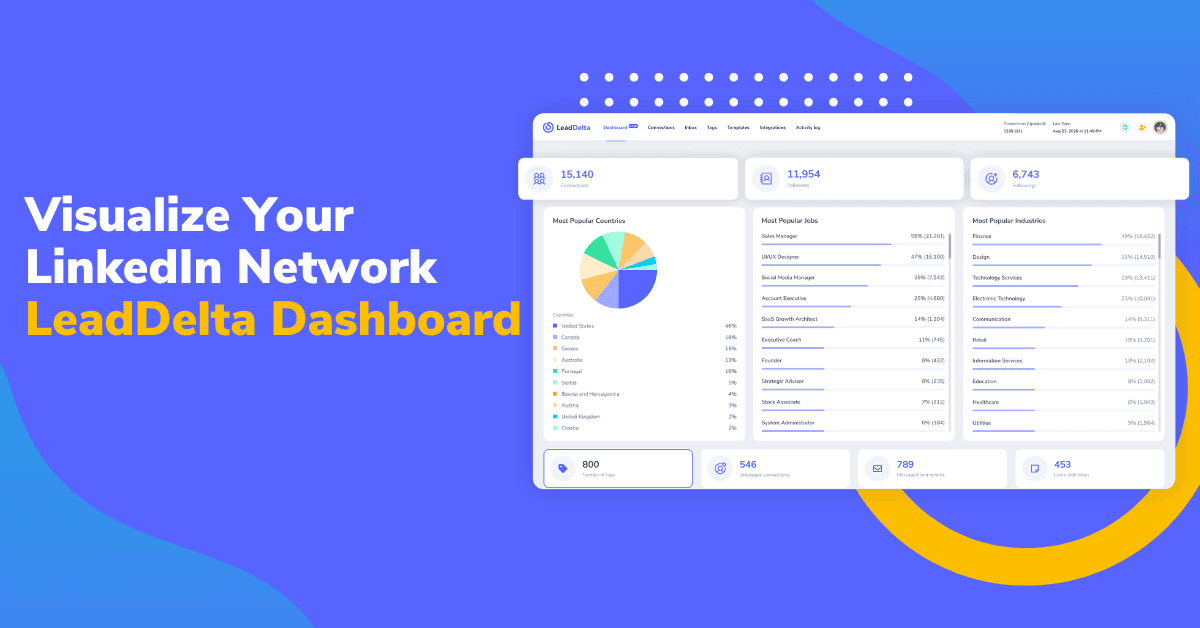
Among its many features allowing you to manage your network, LeadDelta allows you to have a 360-degree view of your network with its Dashboard.
Once you first log into LeadDelta and your LinkedIn connections are synced, click on the Dashboard button in the top navigation bar.

This will open up your personalized LinkedIn Dashboard with important numbers to keep in mind, like:
- Connections you have on LinkedIn.
- Followers you have and the number of people you’re following.
- Connections labeled with LeadDelta Tags.
- Connections you have conversations with.
- Connections with LeadDelta Notes attached to them.

Clicking on any one of these information prompts will direct you to the connection tab and filter your network accordingly.
For example, filtering all the connections with Notes attached to them.

Now let’s get into the most important information, the overview of your LinkedIn network split by three criteria: where they’re from, what they do, and which industry they are in.
This information is neatly split into three columns:
- Most Popular Countries.
- Most Popular Jobs.
- Most Popular Industries.

Going into it a bit deeper, the left-most column contains a pie chart breaking down where your connections are from.
The list below shows the percentage of your network living in each of the given countries with the ability to click on them and get a list of the people from those countries.

In the middle, your network will be broken down into specific job titles your connections have, or their current positions.
Outlined by the exact number and percentage of your network in those positions, clicking on any job title will filter your network and show you a list of people with those job titles in your network.

Lastly, on the right, you can see all the industries your connections occupy according to numbers and percentages in your network.
As with all the other categories, clicking any industry will filter your network for that specific industry.

Check out how it works in practice.
Why It’s Important To Have a Better Overview of Your Network?
When you just start connecting with people on LinkedIn it’s easy to keep track of where your connections are from and what they do because you are connecting with people you know.
But what happens when you start connecting with people whose posts you like, people someone recommended you to connect with, potential customers, investors…
In no time you will find yourself having connections from all around the world in different industries and backgrounds and you will lose yourself in this mess.
Having a reliable way to visualize your LinkedIn network allows you to:
- Understand your network structure – Understand who is in your network for greater insights into your structure.
- Identify network gaps – Reveal areas where your network lacks diversity or expertise, prompting you to seek out new connections to fill these gaps.
- Network with a goal in mind – A clear visualization of your network can help you determine better networking goals.
- Track your network’s growth – Reflect on your networking efforts, identify trends, and understand how it’s expanding.
- Increase your productivity – Streamline your networking efforts, making it easier to identify key contacts, prioritize interactions, and stay organized.
Networking isn’t about getting to a 30.000 connection limit as fast as possible, it’s about strategically connecting with people and getting value from those connections.
To get this value from your network you have to utilize the data you already have which will help you understand where your network is currently, and what needs to change if you want to hit your goals and grow.
Let’s look at a few useful ways you can utilize the LeadDelta Dashboard.
How Can The LeadDelta Dashboard Help You?
As you saw, the LeadDelta Dashboard helps you visualize your LinkedIn network which unlocks new insights and opportunities.
The two immediate actions you can take with these insights are increasing your post engagement and creating lists for your sales efforts.
Increase Your Posts Reach
If you are creating content on LinkedIn the first few hours are the most important for it to reach as many people in your niche as possible.
If the LinkedIn algorithm determines that your post doesn’t spam and isn’t inappropriate it is shown to a handful of your connections, if they like it it’s shown to a wider group of people, and so on.
The key is to intrigue the first group who sees your post for it to get a boost. So the two factors are timing and interest.
Knowing where the highest percentage of your connections are from will give you a better understanding of when the best time to post is for your content to get the most views.
And if you are creating content for let’s say Designers, your content won’t resonate that well with founders, salespeople…
Easily Create Lists For Your Marketing/Email Campaigns
Let’s say you are looking to start a new campaign for your target audience which is salespeople. You will need a list of people to start it.
You can create a list for your campaign using your current LinkedIn network.
First, you would need to set your goal of how many people you want in your campaign and use the Dashboard to check how many people in your target audience you currently have.
If it’s less than needed, get to connect with new people.
Once you are ready go to your dashboard and search for your target audience in the most popular jobs tab. By clicking the target you need you will get a list of all connections with that job in their title.
Now you can select them and export your LinkedIn connections into a CSV file with their information and plug that list into your marketing/email campaign tools.
You can check how many founders, and salespeople you have in your network and if you think they don’t bring value to your network currently you can disconnect those connections, instantly getting your content in the feed of people that it’s intended for.

Within just a few clicks, you can start successful sales campaigns without the need to purchase expensive lead lists.
Conclusion
Having a visual map of your LinkedIn network isn’t just a fun way to see what your network looks like.
It can give you great insights into your network growth and a platform to reach your goals.
LeadDelta provides a reliable way of visualizing your LinkedIn network giving you insight into different criteria you would want to filter your network by.